The surprising leaders of international student mobility

Over the past three decades, international higher education (IHE) has become an important focus in national and institutional strategies. Encompassing a range of activities like mobility, collaborative research and transnational education, it has increased competition within the sector, now amplified in the context of the COVID-19 pandemic. Within this context, it is more important than ever to truly understand the IHE landscape.
Knowing who the major global players are, and why, can help other countries to rise to the challenge. Yet most analysis of IHE looks at the ‘key players’ from a specific view – analysing success based on volume. This approach simply reflects a country’s overall size and means the same countries often get credited as the best – such as the US, the UK, Australia and China.
However, it is important to recognise that this is not the only indicator of a country’s IHE performance. Using student mobility – the largest and most rapidly growing form of IHE – as an example, we can analyse the data using an alternative, genuinely comparable measure of success: the proportion of students that countries send and receive. Looking at the data through this alternative lens highlights other ‘key players’ in student mobility – and raises questions about what we might learn from their performance.
The ‘big players’ in student mobility are not just those with the biggest population or size
Inbound international students
There are two sides to student mobility. The first is the inbound flow of international students, which measures how many tertiary students from abroad are studying in each country. The chart below shows the top 10 receivers of international students in terms of volume (with the dark blue line showing volume for each country) compared to the proportion of students this accounts for (teal bars). Comparing these stats shows a wildly different picture of many key players. While the US is top for volume, they are one of the weakest of the top 10 in terms of proportion. In contrast, the UK and Australia have relatively high proportions of inbound students and perform well on volume of students.
Figure 1: Top 10 countries for inbound mobility by volume
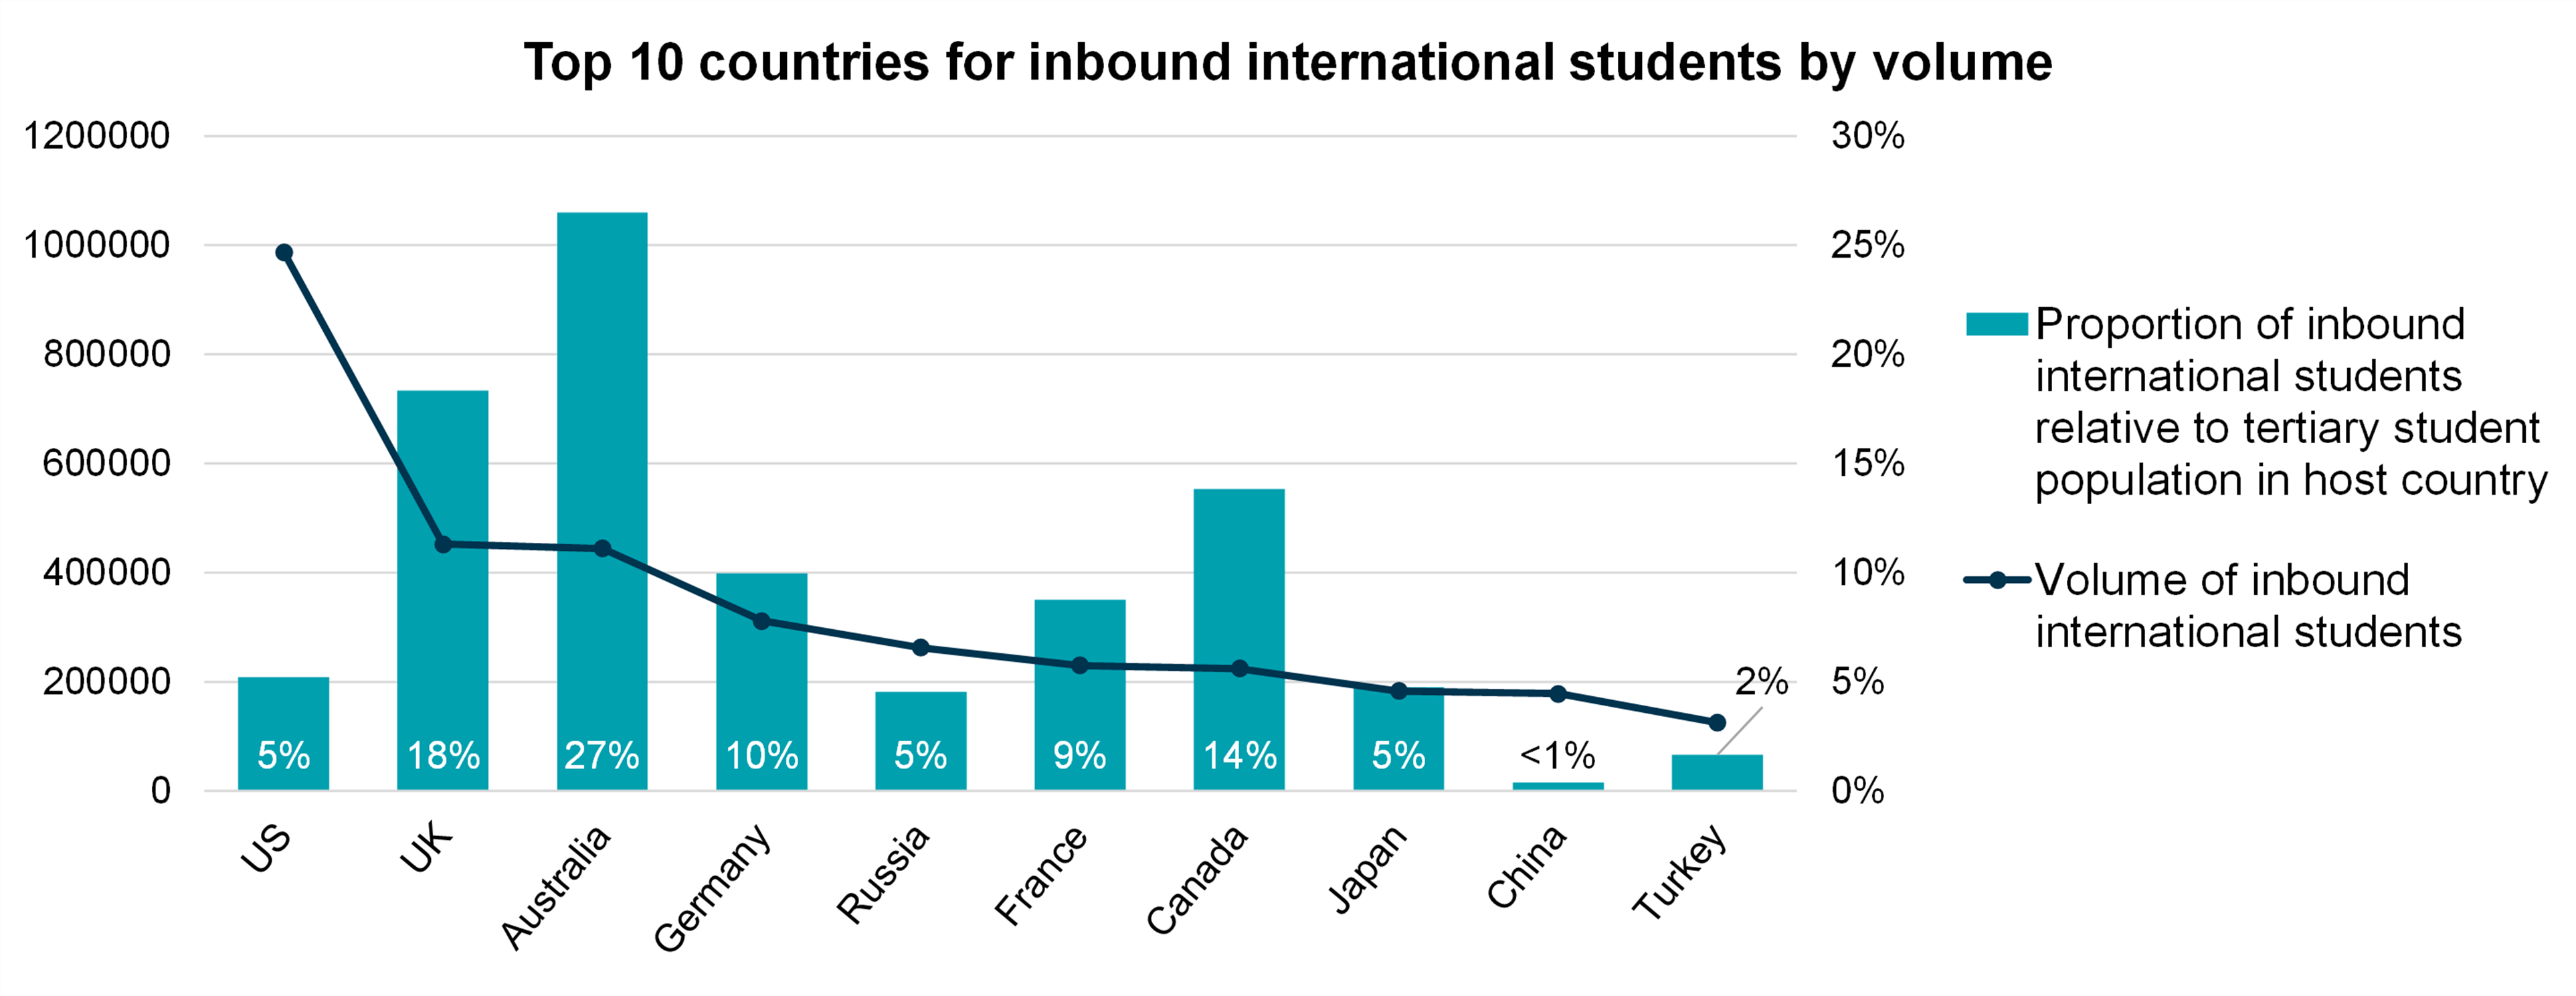
Figure courtesy of IFF Research
This alternate measure also shows a different picture when looking at the genuine top 10 for proportion, shown in Figure 2 below. When looking at proportion globally, some new faces – such as Luxembourg and Qatar – appear as the top performers. These countries, and many others in the top ten, are somewhat surprising, and are rarely mentioned as IHE successes.
Figure 2 Top 10 countries for inbound mobility by proportion
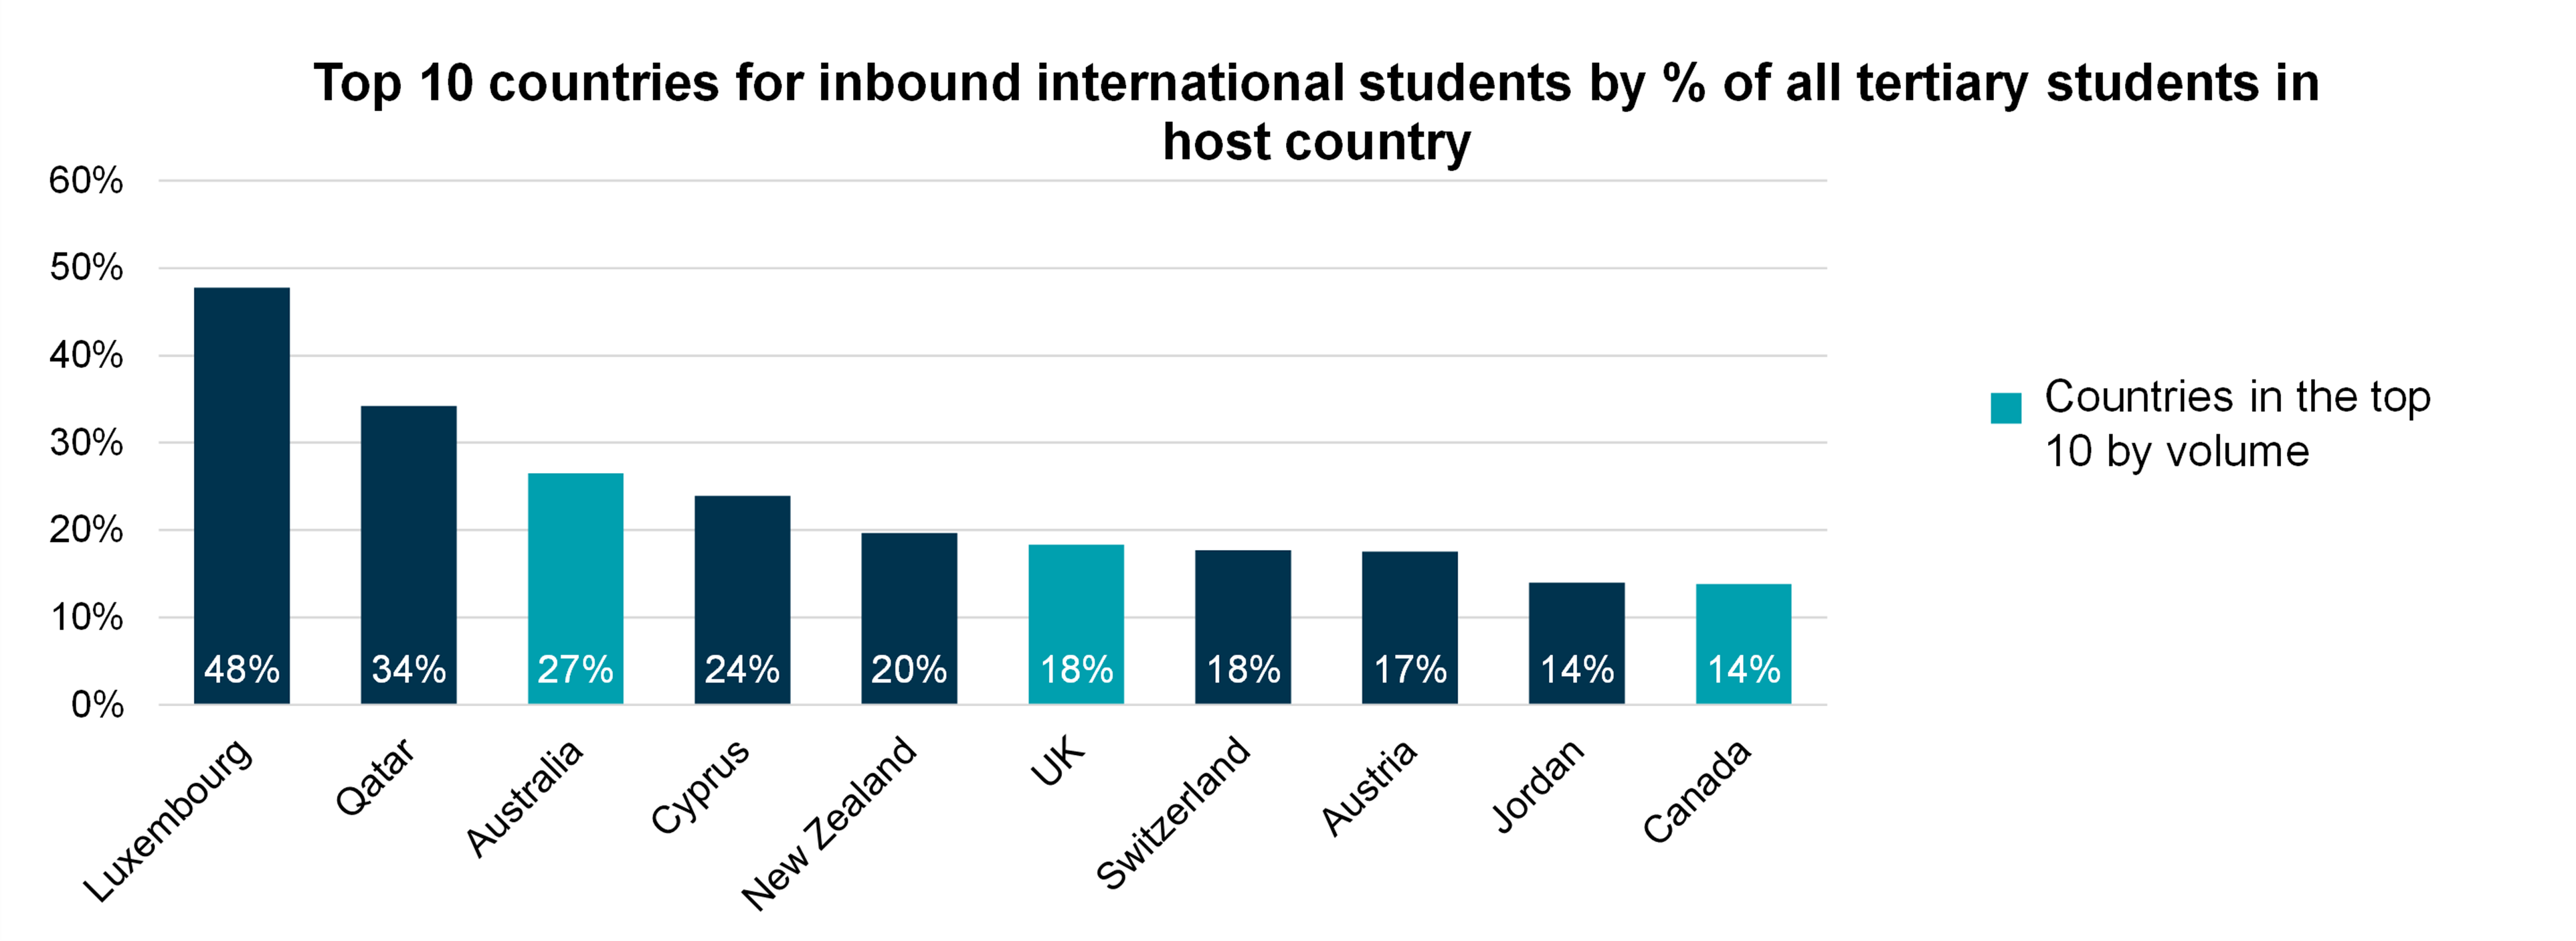
Figure courtesy of IFF Research
So, why do these countries have a high proportion of inbound students?
More research is needed to explore the stories of the other ‘unexpected’ countries to understand what contributes to their relative strength and what other institutions hoping to attract international students could learn from them. Luxembourg, as an example, comfortably holds the status of the country with the highest proportion of inbound students – accounting for almost half of the tertiary student population. A quick search suggests this country’s universities are known for providing multilingual programmes in French, German and English, with several Master's and Doctoral programmes taught entirely in English. Further, the University of Luxembourg is frequently ranked top in the World University Ranking in relation to ‘international outlook,’ suggesting a welcome atmosphere for student mobility.
Outbound international students
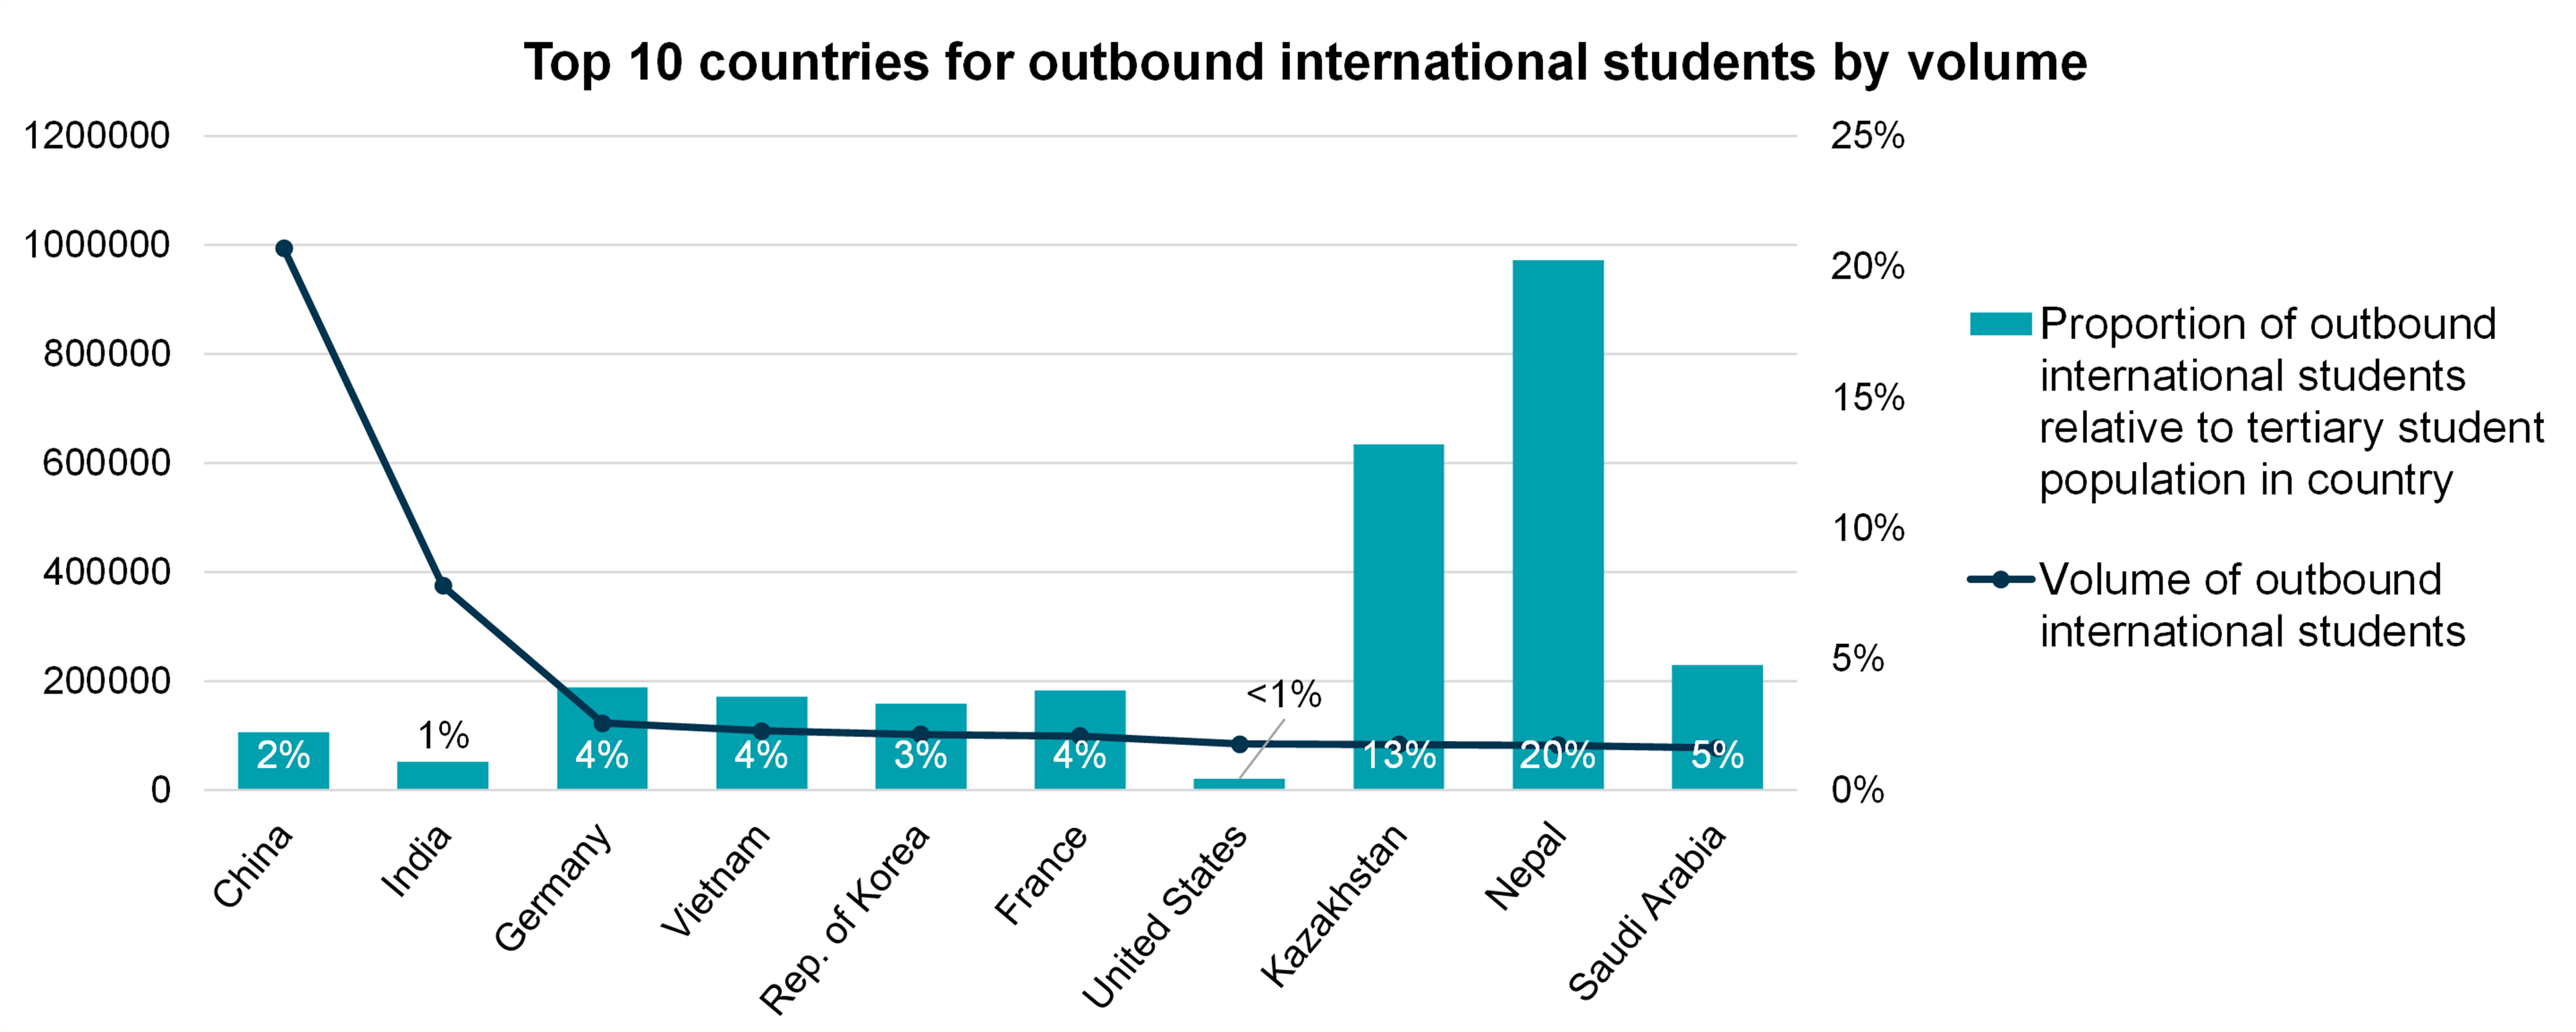
Outbound mobility – or the sending of students to international locations – is the second dimension of student mobility. As shown in Figure 3, this measure also shows major differences in those who look strong based on raw numbers (volume) versus when comparing proportionally. China is by far the greatest sender of international students by volume, followed by India. Both are well-recognised in terms of student mobility due to these volumes, but this is predominantly a reflection of each country’s population size; a look at what proportion of tertiary students these volumes represent brings other countries into focus.
Figure 3: Top 10 countries for outbound mobility by volume
Graph courtesy of IFF Research. Data from http://data.uis.unesco.org/Index.aspx
Notable senders for high proportions are Nepal (20%) and Kazakhstan (13%). As before, looking at these ‘unexpected’ countries provides some useful insight. Nepal's strong performance comes from two key things: first, only 1% of the country’s higher education institutions offer post-graduate level degrees and, second, the impact of the 2015 earthquake and aftermath created greater demand for, and accessibility of, outbound study. While this is perhaps less a ‘success’ than a consideration of local capacity, it nevertheless makes them a strong global player. In contrast, outbound mobility is the primary focus of Kazakhstan’s internationalisation strategy, with ease of mobility to certain countries enabling this (particularly elsewhere in the region, with the Russian Federation the most popular destination owing to proximity, cultural and language ties, pricing and quality of institutions, and ease of admission). That said, there have been recent increases in the numbers looking to study in the West, not least due to the entry of Kazakhstan into the European Higher Education Area, creating an opportunity for countries such as the UK to attract students usually tied to their country neighbours.
Closing thoughts
The ‘big players’ in student mobility are evidently not just those with the biggest population or size. Exploration of countries with a high proportion of inbound/outbound mobility changes our understanding of what successful mobility looks like. Although reasons for a high proportion of inbound and/or outbound students may be owing to specific characteristics and circumstances, having specific IHE systems or policies in place can support ease of international study.
As such, other countries could have a lot to learn from these countries by asking questions such as what the appeal of a given country is to prospective international students, what systems or other enablers are in place for students to travel to/from this country, and what the optimum balance of domestic versus international students is. Further research in this area can help institutions wanting to better their international outlook, and contribute towards IHE becoming accessible to a greater diversity and volume of learners.